Introduction to R and RStudio (MT2)
Learning outcomes
At the end of today’s workshop you should be able to do the following:
Demonstrate knowledge of how to interact with R using RStudio
Identify and employ the basic tools of R Markdown to understand R Notebooks
Basics
The goal of this lab is to introduce you to R and RStudio. Let us first clarify which is which:
R is the name of the programming language itself, and
RStudio is a convenient interface allowing you to use R easily.
I strongly encourage you to explore beyond what the workshops cover. A willingness to experiment will make you a much better programmer. Before we get to that stage, however, you need to build some basic fluency in R. Today we begin with the fundamental building blocks of R and RStudio: the interface, R markdown, and basic commands.
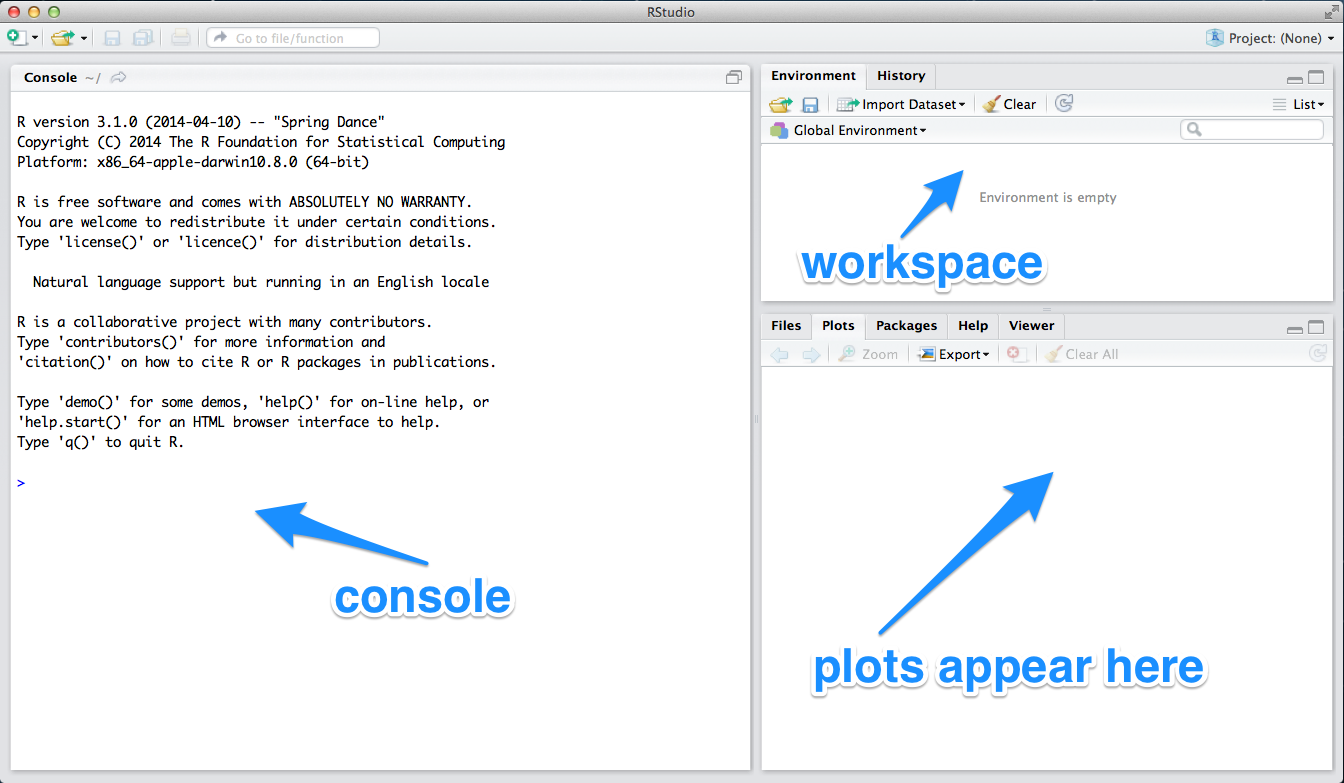
R Interface
The panel in the upper right contains your workplace as well as a history of the commands that you’ve previously entered. Any plots that you generate will show up in the panel in the lower right corner.
The panel on the left is where the magic happens. It’s called the console. Every time you launch RStudio, it will have the same text at the top of the console telling you the version of R that you’re running. Below that information is the prompt.
As its name suggests, this prompt is really a request, a request for a command. Initially, interacting with R is all about typing commands and interpreting the output. These commands and their syntax have evolved over decades and now provide what many users feel is a fairly natural way to access data and organize, describe, and invoke statistical computations.
To get you started, try the following commands at the R prompt (i.e. right after > on the console).
- 556 + 232
- 72/4
- sqrt(144)
- log(10)
You can either type the command in manually or copy and paste it from this document. So, as you can see, R is a good calculator. Later, we shall also see that R can be used to graph functions and create a variety of interesting graphics.
R Markdown and R Notebooks
This document is based on an R Notebook or R Markdown document. R notebooks are meant to be like Lab Notebooks in the sciences where you “do (data) science” by:
- Using code chunks to perform an activity
- Seeing the output of the code chunk, and
- Commenting on the code and its output in prose between the code chunks.
R Notebooks are interactive documents. The notebooks can check the code while you write it, suggesting corrections where errors appear and displaying output when you run a code chunk. We shall see this in action several times during the workshops.
Lets practice this by creating a brief CV of your fictional alter ego in an R Markdown document.
First, open an R Markdown document:
To File -> New File -> R Notebook
The file will be pre-populated with some content. Ignore it for the moment.
You will lightly edit the top of the page between the — lines (you’ll only change the title)
Then, you’ll mostly edit after that in the body of the document
Using the R Markdown quick reference (In R Studio navigate to Help -> Cheatsheets -> R Markdown Reference Guide), figure out how to ensure the following:
The title of the file (and the document itself) should be your name
You should include headings for (at least) education or employment
Each of the sections should include a bulleted list of jobs/degree(s)
Highlight the year in bold
Include an image of yourself or fictional character (either a local file or url).
Add a horizontal rule
Add a block quote
Insert and run two pieces of basic R chunk (e.g., sqrt(10))
Having done this, go to the top of the page where it says ‘Preview’ on the arrow next to knit click on the arrow and select ‘Knit to HTML.’ It will then produce an html document. If you are happy, go ahead and click “open in browser” on the left hand corner of the pop-up. There you can save the webpage as a PDF (using print -> save as pdf) and then upload the pdf of your CV to the PB130 CV forum for feedback (details for how to save the website as a pdf on a Mac can be found here: https://www.lifewire.com/save-web-page-as-pdf-in-safari-4169534).
Here is an example: http://rpubs.com/thomcurran/CV
We will be using notebooks to complete the weekly worksheets. Go away and have a play with this in your own time. After the session please do post your CVs on the PB130 forum so we can see them!
This lab was adapted for PB130 by Thomas Curran from a lab written by Mark Hansen of UCLA Statistics.